
Project overview
2410 developed a custom WordPress plugin to capture data submitted via an embedded Typeform form, process the data through an API, and dynamically generate a chart to visualize the input on a "Business Value vs. Difficulty of Implementation" matrix.
The user flow included redirecting to a results page where the visualization would be displayed, enabling the client to demonstrate value propositions to internal stakeholders.
Very detailed and also was able to guide me toward a better solution than I had envisioned starting off.
Thank you!
- tsurfs
Key features delivered
- Typeform API integration for real-time data capture
- Dynamic chart rendering
- Custom chart segments: Low Hanging Fruit, Building Blocks, Differentiators, Bears
- Backend data handling in WordPress
- Installation manual and test website for demonstration
Screenshots
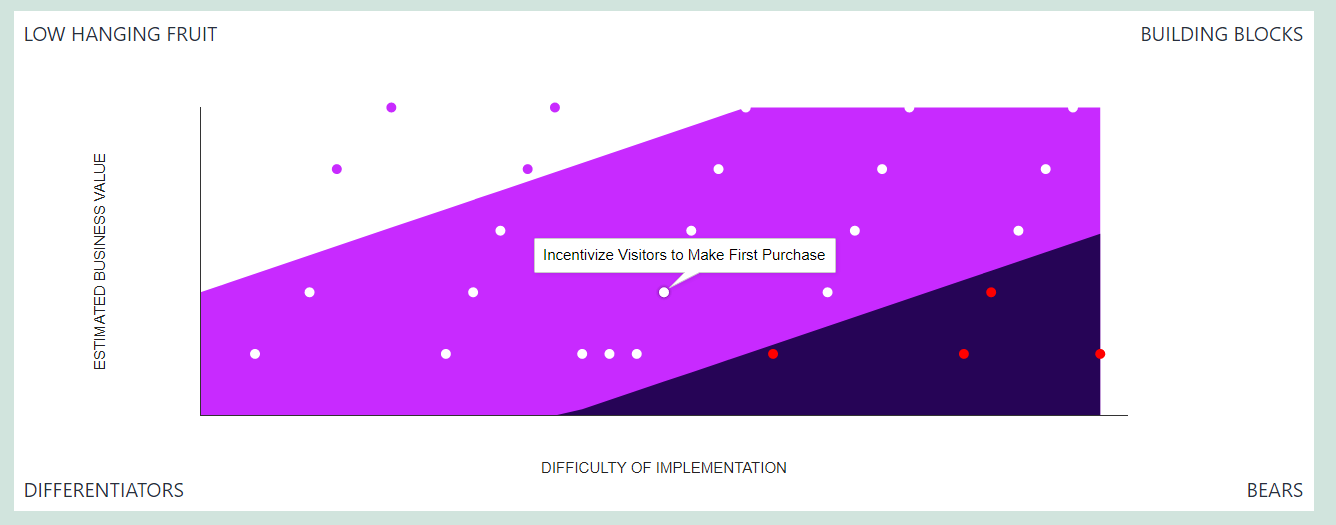
Example of the results visualization chart showing business initiatives categorized by value and effort, with tooltips displaying initiative details.
Technology stack
WordPress
Typeform API
Google Charts or alternative JS charting library
PHP
JavaScript